Let’s talk about something super exciting
Alright, folks, gather ’round!
Let’s talk about something super exciting we’re diving into on the farm: mapping every single sector! Yep, you heard that right. This isn’t just about planting some trees and hoping for the best. Oh no, we’re going full-on organized, and let me tell you, it’s going to be awesome.
Why are we doing this, you ask? Well, for all the haters and nay-sayers out there, this is how we’re building a rock-solid foundation for our farming system. Think of it as the ultimate farm blueprint.
Here’s the breakdown:
Sector by Sector:** We’re breaking down the entire farm into 20 neat little sectors. Each sector will have its own personality, depending on what we’re growing there. UHSN, LHS, UTSH, LIS….
Row Labels:** Within each sector, we’re labeling the rows. This helps us keep things tidy and makes it super easy to find what we’re looking for. 1, 4, 7, 10 for Coconuts and Fruit trees. Rows with 2, 3, 5, 6, 8, 9…. is for the third canopy, Interlines.
Tree Numbering:** Every single fruit tree and coconut palm gets its own unique number. This is where things get really cool! LHS-R2 CNT2 -> Lower Hybrid Section, Row 2, CNT #2

Fruit Tree and Coconut Planting Details:
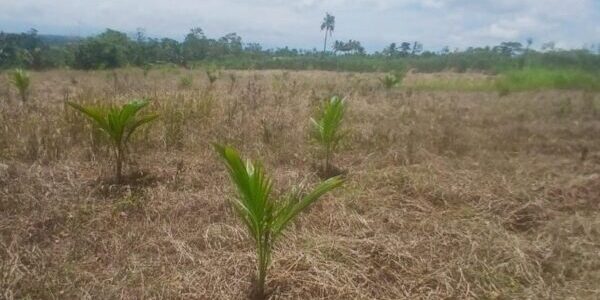
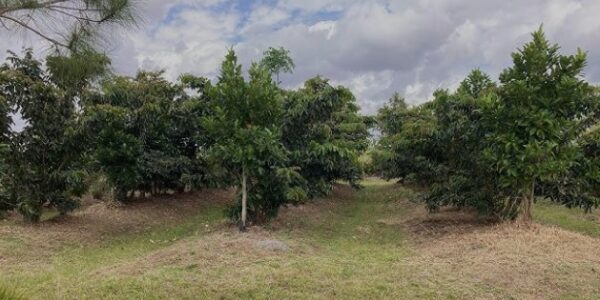
We are planting a variety of fruit trees and coconuts. We’re talking about everything from Lanzones, Durian, and citrus trees to different types of coconuts. Each tree will have its own spot, its own number, and its own little profile in our farm map.
Intercropping Value Fruits:
We’re not just about monoculture here! We’re all about maximizing space and getting the most out of every inch of our land. We’re going to intercrop value fruits, which means planting different types of crops together. This is a great way to diversify our harvest and make sure we have something delicious all year round.
How much is your Gross Revenue per square meter planted?
So, what’s the big deal about all this mapping? Well, it’s all about information and control.
Tree Health:** We’ll know exactly which tree is sick. Thanks to our numbering system, we can quickly identify and treat any problems.
Harvest Tracking:** We’ll be able to track the harvest per sector and even get averages per tree. This helps us understand what’s working, what’s not, and how to improve our yields.
Data-Driven Decisions:** This data is going to help us make smarter decisions about what to plant, how to care for our trees, and how to maximize our profits.

This project is essential. It’s going to transform the way we farm and set us up for success, God willing.
Want to see how we’re doing it? Check out our learning site.